


Project Impact Mapping: Understanding the Interaction between Influence and Impact
- Home
- Our Blog

Admin Equator Group
Project Impact Mapping: Understanding the Interaction between Influence and Impact
From these locations, impact mapping will be conducted from the perspective of those affected. This can be a difficult task to illustrate graphically. I plan to illustrate the impact using a vertical graph, where the vertical axis will show the extent of the impact that could derail the project. On the other hand, the horizontal axis will show whether the community is affected or not, as well as their relative position in the graph.
For example, in the graph, the first quadrant signifies entities that have the potential to derail the project, but are not directly impacted. Such entities may have permits but no significant influence. On the other hand, the other quadrant may contain entities that have strong influence and also experience significant impacts. This could include community leaders who have great influence and are directly impacted by the project.
In addition, there may be entities located in quadrants 1, 2, or 3. In quadrant 3, they may have strong influence, but limited ability to influence project failure. For example, this may involve small communities that are affected by the project but do not have much influence.
Search
Recent Posts
-
-
-
-
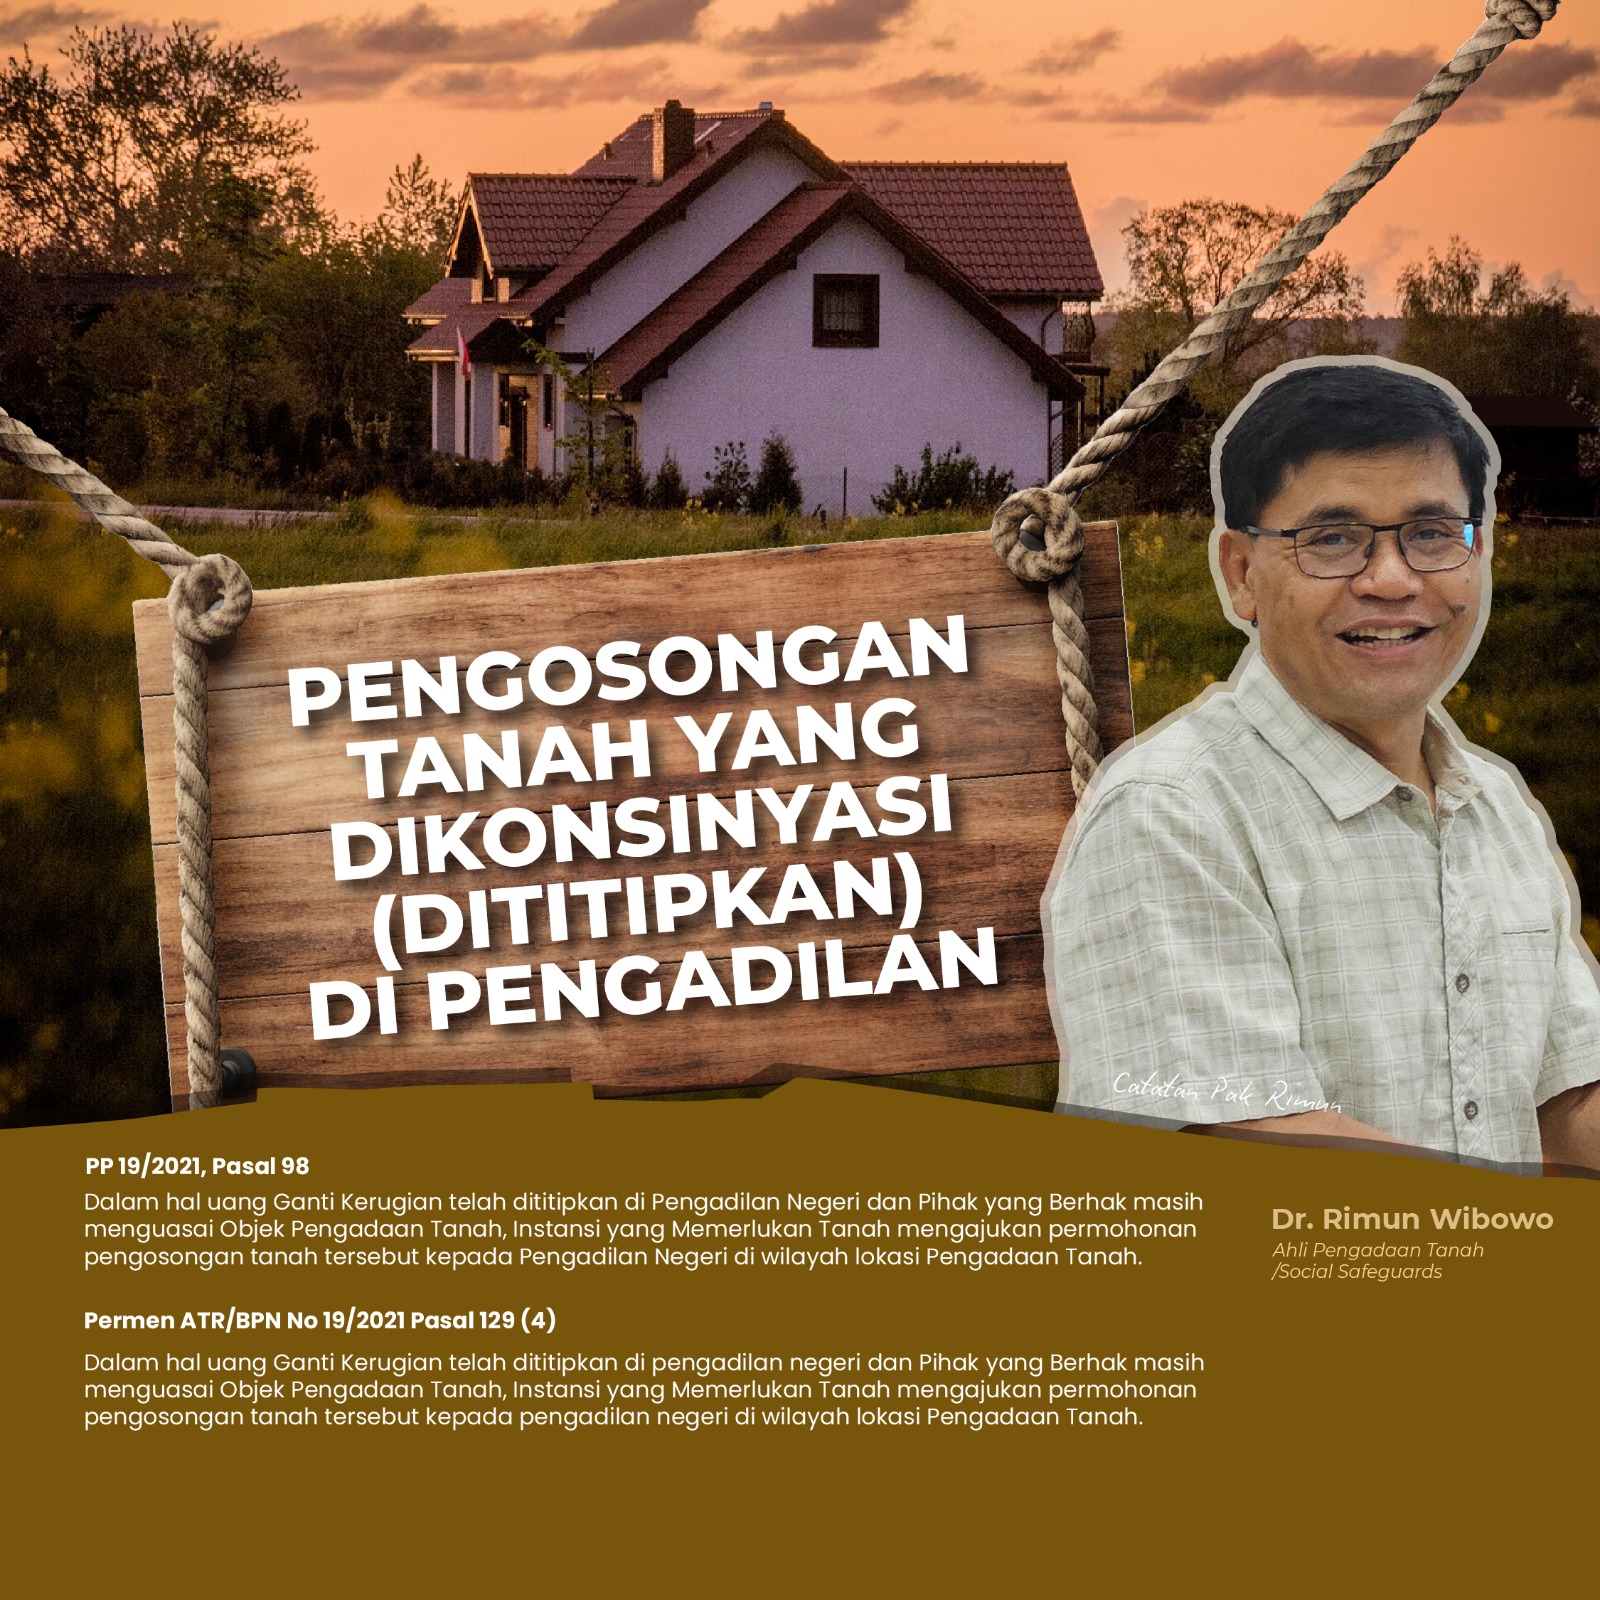
VACATING LAND THAT IS CONSIGNED TO THE COURT
23 Juli 2024
Tags
idul
fitri
1445h
ucapan
stakeholder-engagement
pengadaan-tanah
indonesia
social-safeguards
network-learning-centers
pemetaan
rimun-wibowo
tanah
lingkungan
hubungan-manusia
grievance-redress-mechanism
objek-pengadaan-tanah
konsultasi-bermakna
pemetaan-pemangku-kepentingan
komunikasi-interpersonal
strategi-konsultasi
manajemen-kepentingan
pembangunan-kemitraan
dialog-terbuka
inklusivitas-dalam-konsultasi
efektivitas-pertemuan
pemahaman-minat
pemetaan-dampak
interaksi-proyek-masyarakat
pengaruh-dan-dampak
pengembangan-berkelanjutan
analisis-dampak
lingkungan-hidup
keputusan-pembangunan
keberlanjutan-proyek
kesejahteraan-masyarakat
pengelolaan-risiko
konsultasi-publik
hak-atas-tanah
tata-ruang
tanah-dangkal
ruang-bawah-tanah
pengelolaan-lahan
regulasi-tanah
hgb
kdb
kepadatan-lahan
ruang-tutupan-lahan
pembangunan-berkelanjutan
konflik-kepemilikan-lahan
regulasi-sumber-daya-alam
pendekatan-sistematik
pendekatan-kontekstual
uu-pokok-agraria
kepemilikan-negara
rezim-perizinan
kesejahteraan-rakyat
pengelolaan-berkelanjutan
penambangan-galian-c
izin-tambang
barang-warisan-budaya
hukum-penambangan
legalitas-tambang
regulasi-tambang
penemuan-barang-bersejarah
konsekuensi-hukum-penambangan
peraturan-tambang-indonesia
aktivitas-bawah-tanah
aturan-penggalian-tanah
hukum-barang-antik
proses-perizinan-tambang
pelanggaran-hukum-tambang
land-acquisition
community-engagement
development-projects
indigenous-rights
public-consultation
regulatory-compliance
social-impact
corporate-responsibility
kepemilikan-tanah
masalah-tanah-indonesia
bukti-fisik
kepala-desa
verifikasi-kepemilikan
indonesia-timur
kesaksian-saksi
transparansi-tanah
proses-tanah-jawa
mekanisme-penanganan-keluhan
mpk
sistem-penyelesaian-keluhan
keluhan-proyek
transparansi-proyek
akuntabilitas-proyek
perlindungan-hak-masyarakat
pencegahan-konflik-proyek
implementasi-mpk
pentingnya-mpk
tantangan-mpk
proyek-pembangunan
keluhan-masyarakat
solusi-keluhan-proyek
proses-pengadaan-tanah
tahap-ganti-rugi
daftar-nominatif
grievance-mechanism
transparansi-pengadaan-tanah
keadilan-pengadaan-tanah
hak-masyarakat
infrastruktur-indonesia
proyek-strategis-nasional
tantangan-pembangunan
transparansi
partisipasi-masyarakat
peran-pemerintah
pembangunan-ekonomi
cost-overrun
proyek-besar
pentingnya-safeguards
infrastruktur-proyek
manajemen-proyek
penundaan-proyek
biaya-proyek
menghindari-cost-overrun
pelaksanaan-proyek-efisien
kesalahan-perencanaan
manajemen-risiko
biaya-tambahan-proyek
safeguards-proyek
efisiensi-proyek
melindungi-investasi
keberhasilan-proyek
aspek-sosial-konstruksi
pentingnya-aspek-sosial
dampak-sosial
amdal
perencanaan-proyek
konsultan-sosial
dukungan-masyarakat
konflik-sosial
koordinasi-utilitas
proyek-infrastruktur
utilitas-bawah-tanah
saluran-air-minum
jaringan-pdam
telkom
pln
kajian-utilitas
pelatihan-infrastruktur
infrastruktur-perkotaan
konflik-utilitas
dppt
infrastruktur-kota
ahli-safeguard
dokumen-safeguard
konstruksi
dampak-lingkungan
koordinasi-tim-kontraktor
tanggung-jawab-sosial
konsultasi-safeguard
infrastruktur
dampak-konstruksi
dokumen-proyek
larap
ded
penyesuaian-desain
risiko-proyek
efisiensi
mitigasi-dampak
perencanaan
koordinasi-tim
infrastruktur-eksisting
undang-undang-pengadaan-tanah
uu-cipta-kerja
revisi-hukum
pengelolaan-tanah
pengembangan-infrastruktur
kepentingan-umum
hukum-indonesia
perubahan-hukum
tanah-negara
tanah-skala-kecil
pp-192021
penetapan-lokasi
efisiensi-pengadaan
efektivitas-pengadaan
pembelian-langsung
pembangunan-infrastruktur
pengadaan-tanah-skala-kecil
peraturan-pemerintah-19-2021
atr-bpn
metode-pengadaan-tanah
prosedur-tahapan
pembelian-langsung-tanah
tata-kelola-tanah
regulasi-pengadaan-tanah
pengadaan-lahan
pembangunan-wilayah
pengadaan-tanah-langsung
hukum-pengadaan-tanah
teknik-pengadaan-tanah
perencanaan-tanah
kementerian-agraria
pembebasan-lahan
prosespembebasan-tanah
panlok
atr
bpn
kjpp
inventarisasi-tanah
penilaiannilai-tanah
ganti-rugi-pembebasan-lahan
musyawarah-pelepasan-tanah
konsekuensi-hukum
penlok
dokumen-perencanaan
konsinyasi-tanah
legal-standing
proses-pengadaan
sengketa-tanah
peraturan-kehutanan
kebijakan-lingkungan
pertanian-berkelanjutan
izin-pemerintah
perencanaan-penggunaan-lahan
kepatuhan-hukum
administrasi-desa
manajemen-sumber-daya
dokumen-perencanaan-pengadaan-tanah
kualitas-dppt
regulasi-dppt
profesionalisme-penyusun-dppt
lisensi-profesional
bnsp
transparansi-informasi
skkni
tata-kelola-tata-ruang
perencanaan-pengadaan-tanah
standar-kompetensi-kerja-nasional
ganti-kerugian
nilai-penggantian-wajar
masyarakat-rentan
keadilan-sosial
pembangunan
keseimbangan-kepentingan
kementerian-ekonomi
menko-ekonomi
adb
world-bank
livelihood-restoration-program
kebijakan-pengadaan-tanah
perlindungan-masyarakat
permukiman-kembali
pupr
relokasi
tanggung-jawab-pemerintah
kementerian-pupr
bappenas
proses-relokasi
ganti-rugi
kebijakan-relokasi
implementasi-monev
kesejahteraan-sosial
keseimbangan-sosial
sistem-informasi-pengadaan-tanah
sipt
dampak-sosial-pengadaan-tanah
pemerintah-daerah
evaluasi-dampak-sosial
hak-asasi-manusia
peningkatan-kesejahteraan
asian-development-bank
pelatihan-involuntary-resettlement
peningkatan-pengetahuan
peningkatan-kemampuan
staf-proyek
lembaga-eksekutif
lembaga-pelaksana
proyek-adb
equator
resettlement-involuntary
safeguards-ir
program-pemulihan-mata-pencaharian
mekanisme-anggaran
dokumentasi-pelatihan
video-dokumentasi
proses-pembebasan-lahan
pp-19-2021
permen-atr-bpn-19-2021
pengadilan-negeri
negosiasi-dalam-itikad-baik
due-process
komnas-ham
proyek-kompleks
pengawasan-independen
hak-pihak-yang-berhak
perlindungan-hak
penyelesaian-konflik
akuisisi-lahan
urutan-kerja-proyek
kerusakan-lingkungan
pencemaran-air
tanah-longsor
deforestasi
kompensasi-adil
penolakan-proyek
protes-masyarakat
tindakan-hukum
sanksi-hukum
denda-besar
penghentian-proyek
tuntutan-hukum
biaya-pemulihan
pencegahan-dampak
reputasi-perusahaan
kepercayaan-investor
dampak-kesehatan
polusi
akses-sumber-daya
legacy-issue
rencana-tata-ruang
kompensasi-tanah
pemulihan-lingkungan
kepatuhan-regulasi
risiko-hukum
keberlanjutan-ekosistem
mediasi-sengketa-tanah
arbitrase-tanah
manajemen-proyek-tanah
ganti-rugi-tanah
hukum-pertanahan
nilai-ganti-rugi-final
mekanisme-pengadilan
penilaian-tanah
tanah-untuk-kepentingan-umum
penilai-publik
tanah-dan-bangunan
kepastian-hukum
prosedur-pengadilan
tanaman-dan-bangunan
informasi-hukum
video-edukasi-tanah
penilaian-ganti-rugi
pengadilan-tanah
proses-legal-tanah
nilai-wajar-tanah
penyelesaian-sengketa-tanah
nilai-tanah-final
kebijakan-pertanahan
prosedur-ganti-rugi-tanah
penetapan-lokasi-proyek
hukum-tanah-indonesia
pengadaan-tanah-umum